Eachway Calculator
INTRODUCTION
This interface provides access to an algorithm designed to find the optimal solution for dutching in each-way markets. Given a budget, the number of places, and the place odds, it calculates the optimal stake to place on each selection. The algorithm can also generate a plot showing all possible outcomes and their associated profits, including the minimum and maximum achievable returns. Additionally, it can determine the optimal bet distribution for a subset of each-way selections—useful when the user finds value only in specific options. This information helps users make informed decisions when betting on each-way markets. Other potential use cases exist, though they are not demonstrated in this interface.
IMPLEMENTATION
This web site is mainly to be used as a proof of concept for the algorithm. It is hosted on a 2-core VPS and is not meant for heavy usage.
ALGORITHM
The algoritm is guaranteed to find the best solution and can be proven to be optimal as well.
INSTRUCTIONS
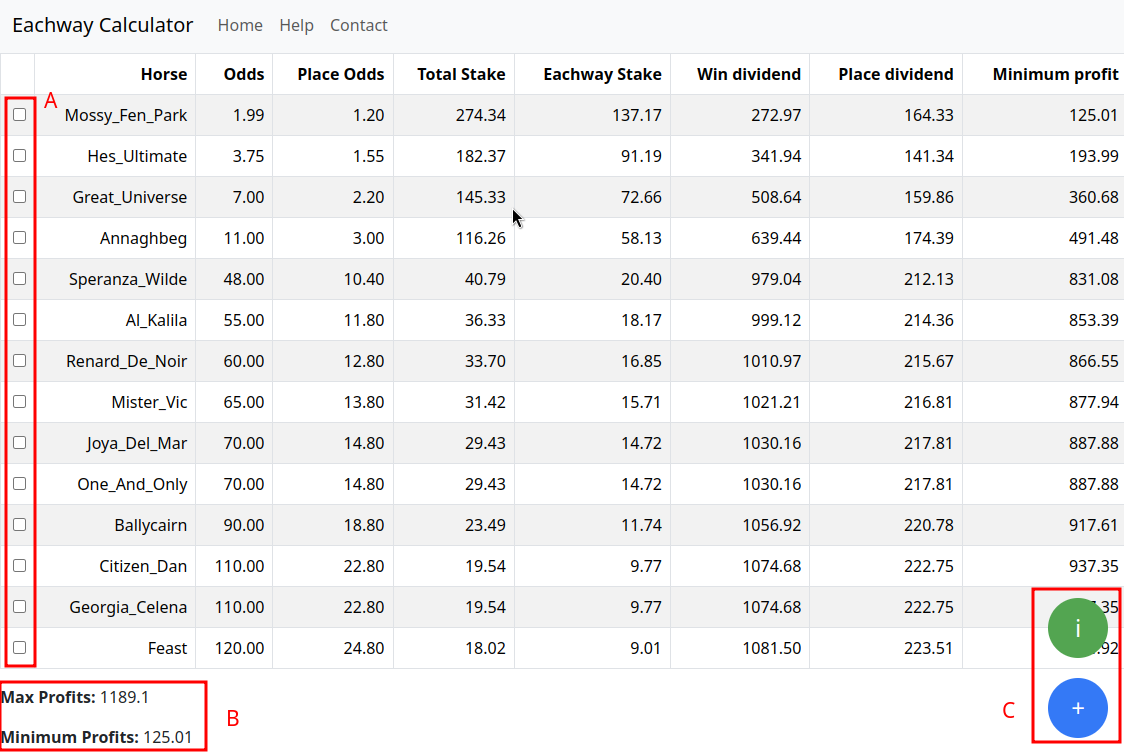
On the main page, you can enter the budget, number of places, and place odds. Then, in the table, you can input the names of the horses and their respective odds. Once you click the button, the algorithm calculates the optimal betting strategy and displays the results in a new table. This output table shows the required stakes for each selection, along with the potential minimum and maximum profits. The table includes the following columns:
- Place odds
- Total stake
- Each-way stake
- Dividend on win
- Dividend on place
- Minimum profit if the selected horse wins
EXAMPLES
Using the examples dropdown, you can select an example that will fill the table with some pre-defined values. You can then click the submit button to see the best stakes and best results possible for the selected example. The examples are based on some real life examples.
SELECTING A SUBSET OF HORSES
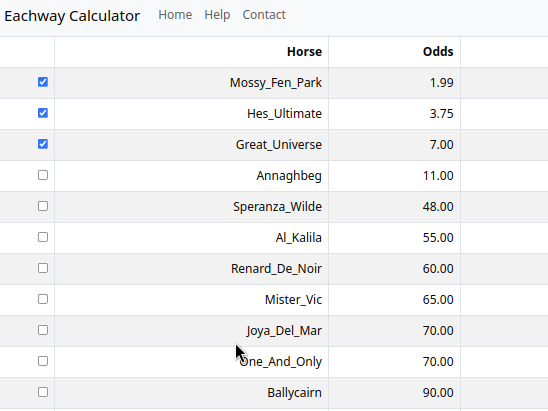
You won't always find profitable dutching opportunities across the entire field, but there may be value in a subset of horses—especially when the place odds are favorable.
If you identify value in a specific set of horses, you can select them using the checkboxes in the results table.
Next, click the blue button with the symbol + in the bottom-right corner of the screen (section C).
The algorithm will then calculate the optimal each-way stakes for your selected horses.
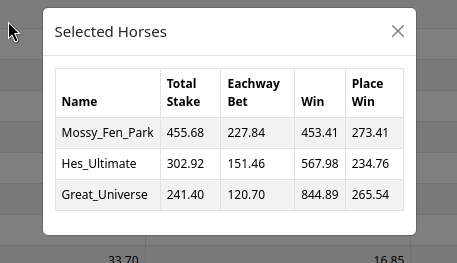
This targeted approach can yield higher profits compared to simply dividing your stake equally among all selected horses.
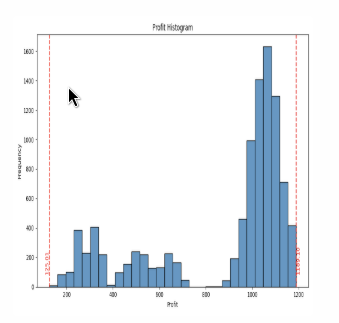
PROFIT GRAPH
The algorithm will also generate a plot that shows all possible outcomes and their profits, and the minimum and maximum profits that can be generated.
This plot can be used to make informed decisions on how to place bets on eachway markets. To access the plot, click on the green button with the symbol i in the bottom right corner when results are displayed.
A modal will open showing a histogram of profits and their frequency. Depending on how many profits are larger than 0 and the min/max profits as a guide, an informed decision can be made to dutch the race.